Data and Statistics
Learn with worked examples, then try the questions below.
1Dot plots and histograms
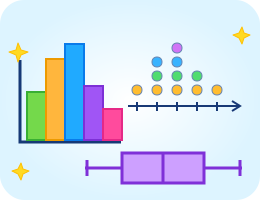
A dot plot places one dot for each observation above its value. A histogram groups numerical data into intervals, using bar heights for frequencies.
Histogram frequencies 0–9: 3, 10–19: 5, 20–29: 2 give 10 observations. Equal-width intervals make the frequencies easy to compare.
2Mean and median
Mean is the total divided by the number of observations. Median is the middle value after sorting; for an even count, average the two middle values.
Median of 2, 4, 8, 10: (4 + 8) ÷ 2 = 6. Extreme values can pull the mean away from the median.
3Box plots and quartiles
A box plot shows minimum, lower quartile Q1, median, upper quartile Q3, and maximum. Here, find quartiles as medians of the lower and upper halves.
The box runs from 4 to 10 with a median line at 7. Interquartile range = Q3 − Q1 = 6. It describes the spread of the middle half.
4Measure variability
Range is maximum minus minimum. Mean absolute deviation (MAD) is the average distance of each value from the mean.
Distances from 5 are 3, 1, 1, 3. MAD = (3 + 1 + 1 + 3) ÷ 4 = 2. Larger spread usually means greater variability.
⭐ Try it yourself!
Question 1 of 5
What is the mean of 3, 5, 7, and 9?
Need a hint?
Add the values, then divide by four.